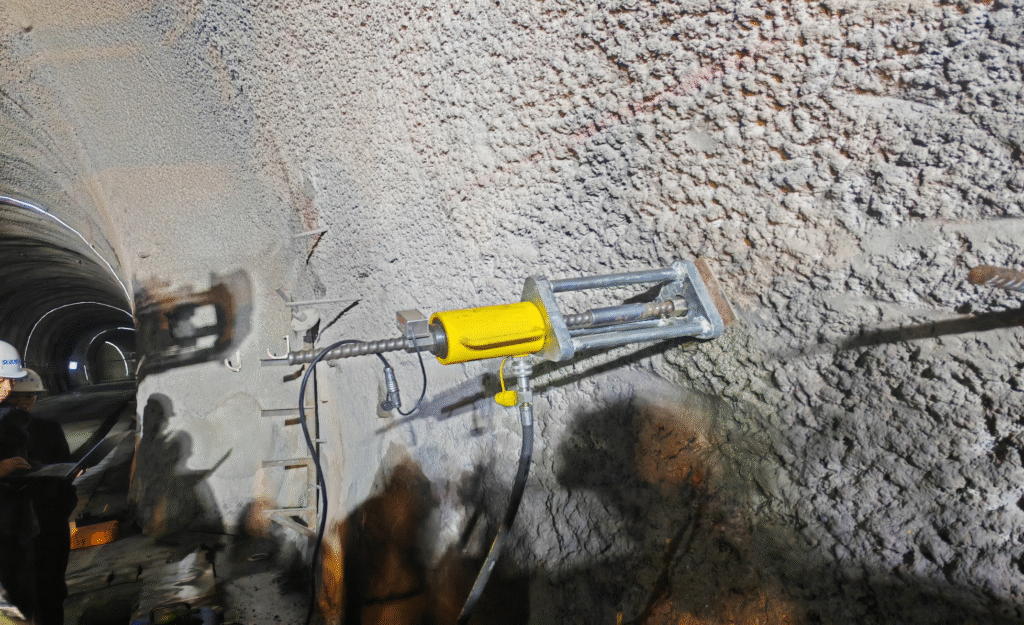
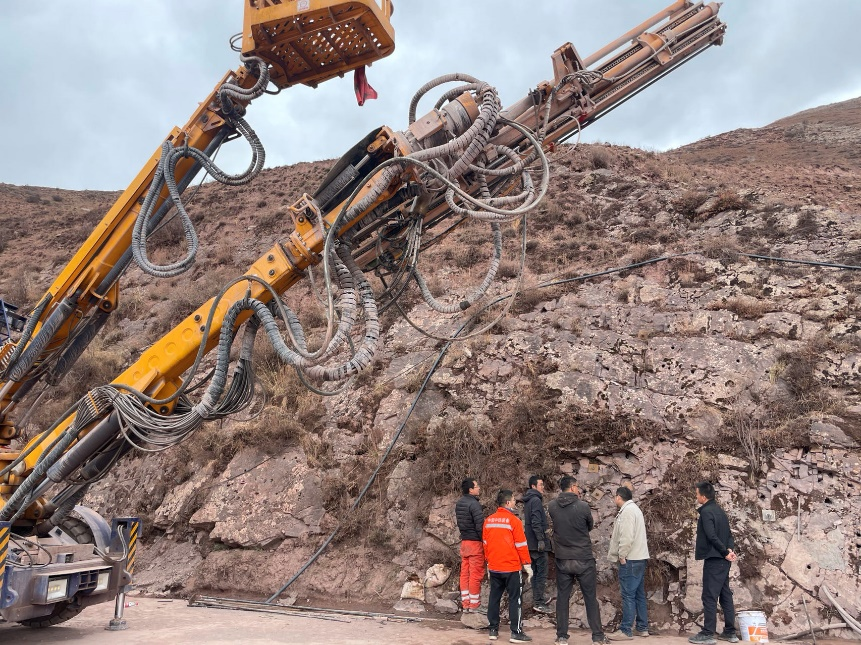
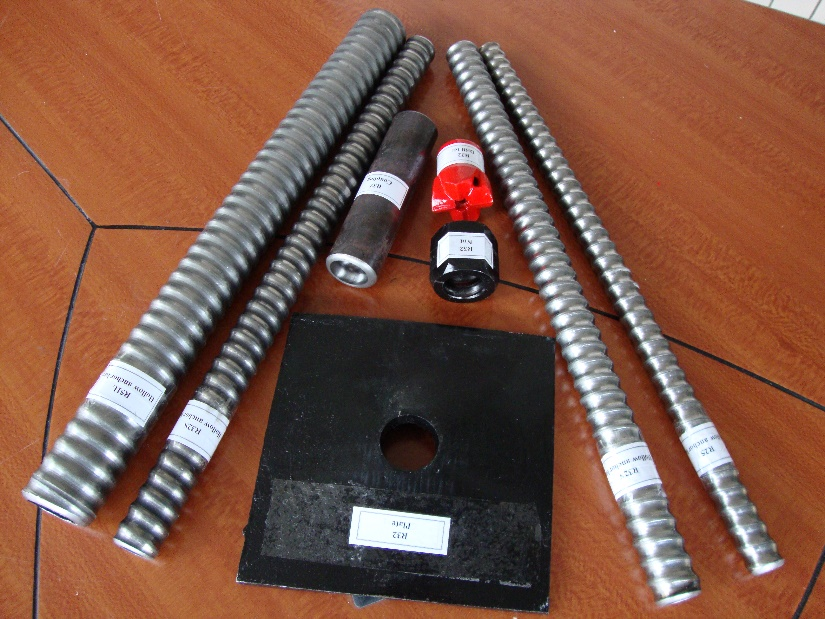
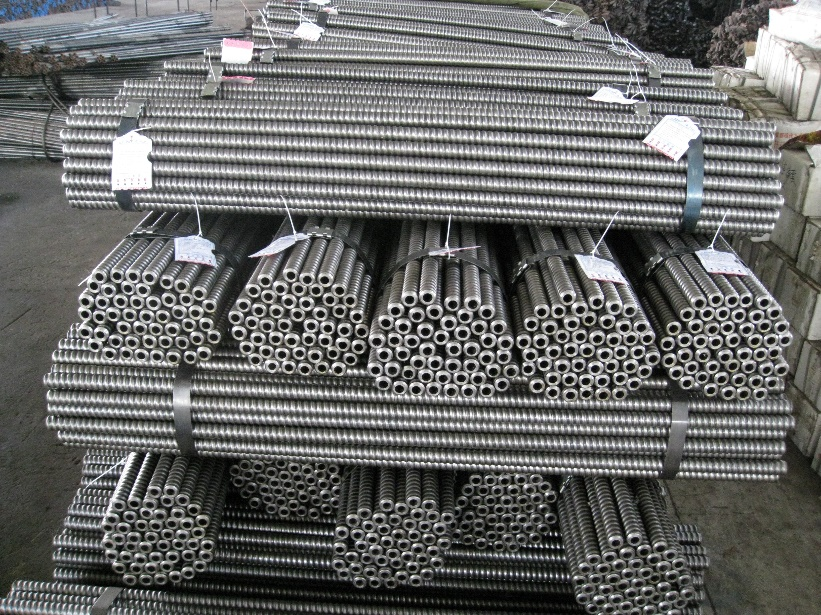
3 Effective Methods to Prevent Hole Collapse During Rock Drilling
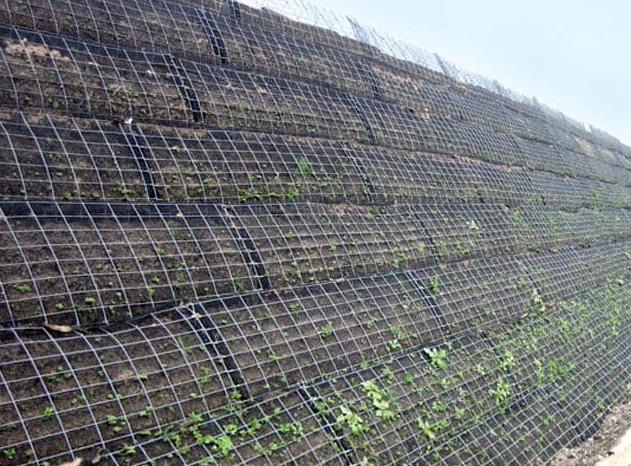
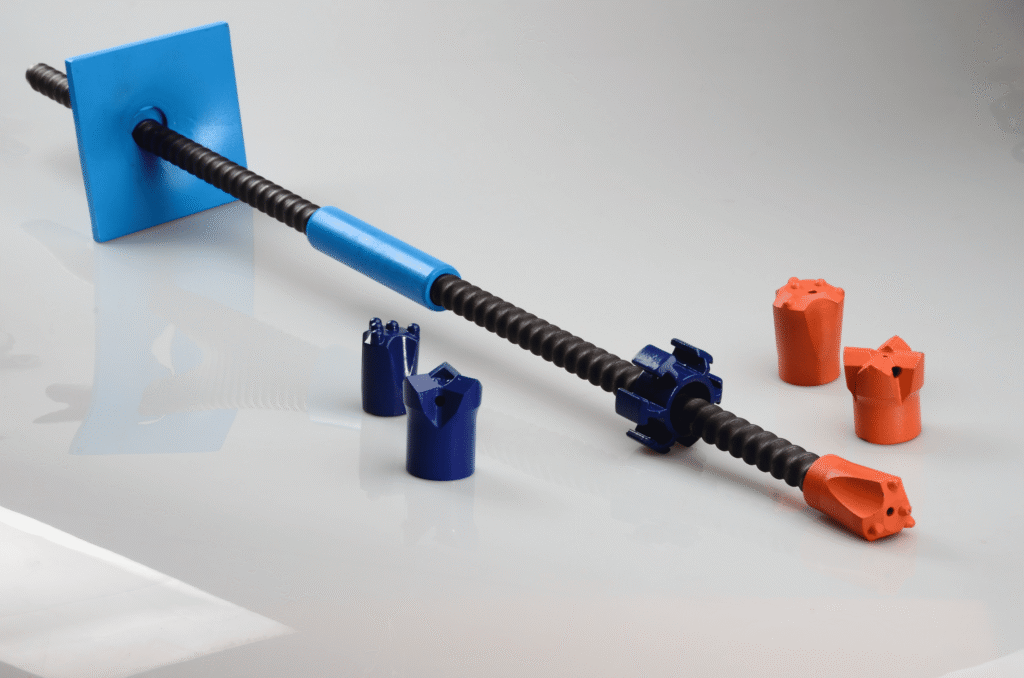
Hole collapse is a common challenge in rock drilling, especially in soft, loose, or fractured geological formations. One of the most critical consequences of this issue is anchor collapse, the failure of the anchoring system due to the instability of the borehole. This can lead to project delays, safety risks, and additional costs. To ensure the […]
3 Effective Methods to Prevent Hole Collapse During Rock Drilling Read More »